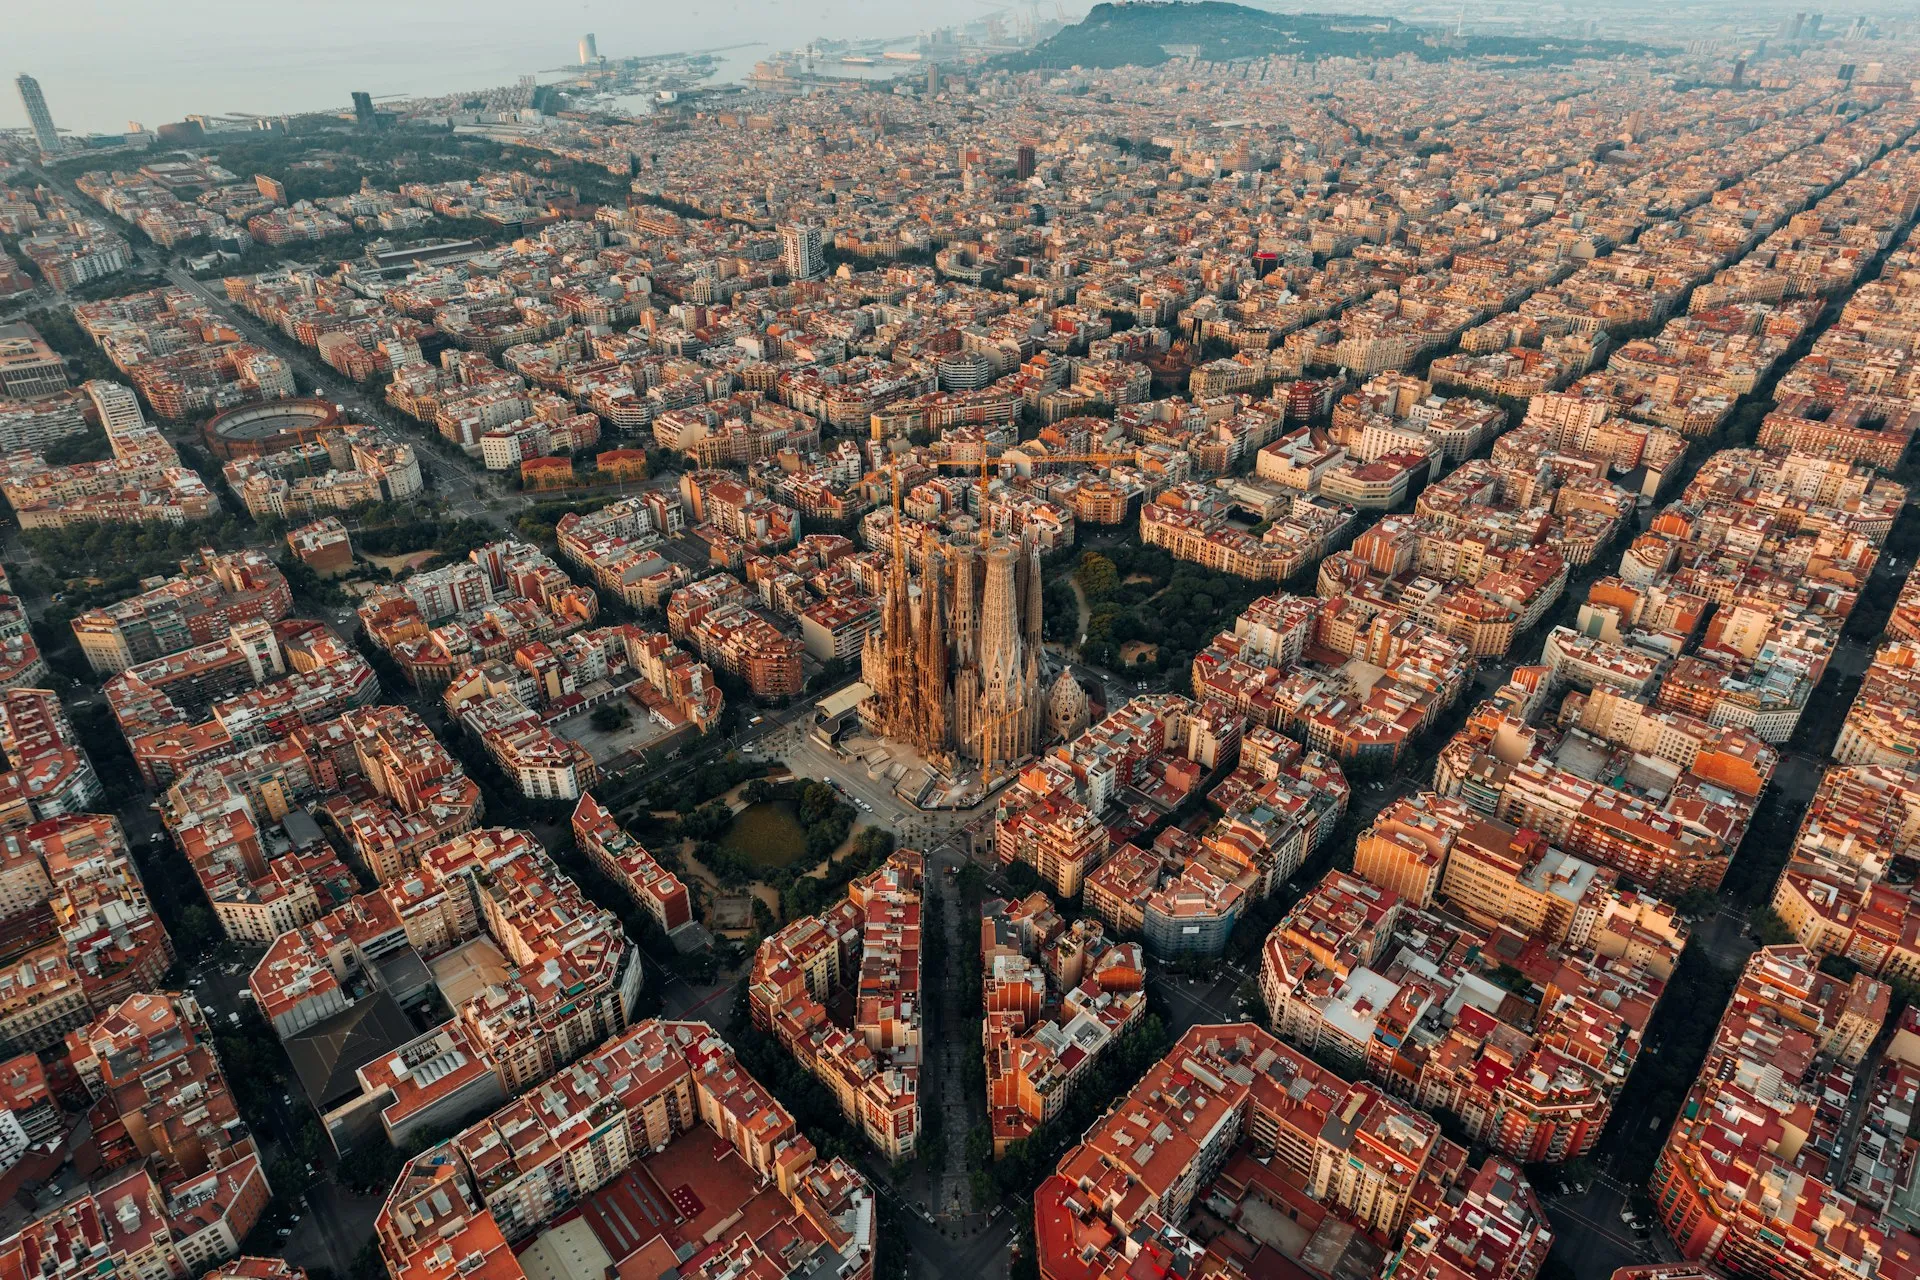


“Barcelona is expensive” sounds true and still says almost nothing. In February 2026, the useful picture was the spread between districts: Sarrià-Sant Gervasi sat at the top of the market in the Idealista Sarrià-Sant Gervasi report, while Nou Barris remained the lower entry point in the Idealista Nou Barris report. Same city, same regulation, very different financial decision.
This guide keeps the February 2026 snapshot explicit. I use Idealista asking-price reports as the listing map, Colegio de Registradores as the closing-price counterweight, and BBVA Research for the macro question: is this just a hot quarter, or is supply pressure doing the heavy lifting?
Working snapshot: portal prices are asking prices, not deeds. Read them beside land-registry data and one blunt question: which buyer can really absorb this price in this district?
Why price per square metre can mislead you
The first mistake is comparing a specific flat with the district average as if they were the same thing. The Idealista Barcelona historical series tracks published asking prices; Registradores property statistics track completed transactions. Mix those layers and you can overprice a property before you even visit it.
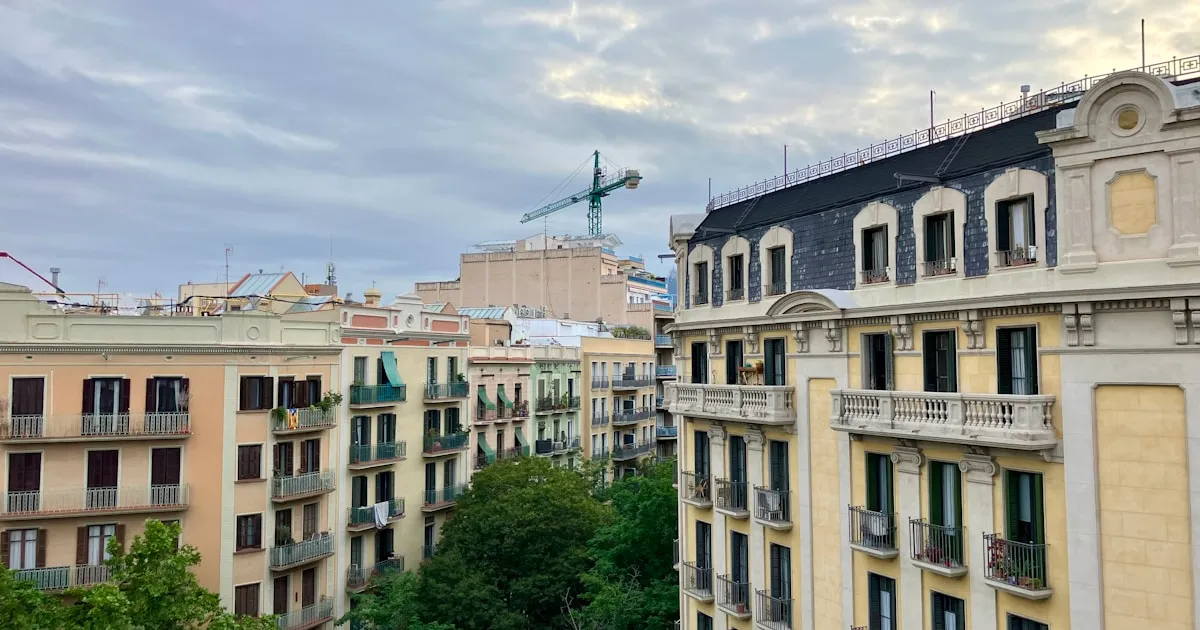
The second mistake is letting the average hide micro-location. A renovated top-floor flat in Sant Antoni and an unrenovated interior flat in Esquerra de l’Eixample can sit under the same district label and still attract different buyers. The Idealista Sarrià-Sant Gervasi report helps locate the city ceiling; the Idealista Nou Barris report shows the entry-market floor.
My working rule is simple: the district sets the range; the building and the flat set the price. If a property is 15% above its area and lacks a strong renovation, high floor, lift, light, or terrace, negotiation room exists. If it is well positioned and has been live for only a few weeks, that room narrows quickly.
Barcelona price map in February 2026
This table keeps the February 2026 snapshot used in the original article. The values come from asking-price sources such as Idealista Barcelona historical data and should be checked against closing-price references such as the Colegio de Registradores 2025 note, which described 2025 as a year of strong growth in registered housing prices.
| District | Average price €/m² | YoY change | Market reading |
|---|---|---|---|
| Sarrià-Sant Gervasi | 6,949 | +14.2% | Prime, less elastic demand |
| Eixample | 6,363 | +8.7% | High liquidity, building quality matters |
| Les Corts | 6,274 | +10.7% | Stable family-buyer demand |
| Gràcia | 5,453 | +7.0% | Scarce stock and local pressure |
| Ciutat Vella | 5,045 | ~+9.5% | Highly dependent on micro-location |
| Sant Martí | 4,885 | ~+14.1% | 22@ and coastal-city pull |
| Sants-Montjuïc | 4,496 | +8.6% | Mid-entry price with urban projects |
| Horta-Guinardó | 3,908 | +9.8% | More space for tighter budgets |
| Sant Andreu | 3,787 | +9.1% | Infrastructure plus established demand |
| Nou Barris | 2,976 | +14.5% | Entry price and price-sensitive turnover |
The reading is not “buy cheap”. It is more demanding. Sarrià-Sant Gervasi may produce a lower rental yield, but it preserves liquidity among high-budget buyers. Nou Barris may offer more percentage upside, but street, building, and condition matter more. BBVA Research points to demand pressure and limited supply; the Registradores February 2026 note confirms that 2025 had already ended with relevant price tension.
For a first home, Sant Andreu, Horta-Guinardó, and Nou Barris require building-by-building discipline. For capital preservation, Eixample, Les Corts, and Sarrià remain more defensive, though the entry price leaves less room for mistakes.
Where liquidity is strongest
I removed the closed days-on-market ranking because the public source pack is not strong enough for the evidence level this editorial contract requires. What can be defended is a liquidity reading: when Idealista Nou Barris shows strong growth from a lower base and Colegio de Registradores confirms registered-price activity, the market is saying that buyers exist, but they are price-sensitive.
In practice, a well-priced flat in Sant Andreu or Nou Barris can move faster than an overpriced one in the Eixample. Neighbourhood brand helps; it does not rescue a launch price that ignores comparable stock. Idealista Barcelona shows asking-price pressure; the Registradores 2025 note is a reminder that closing prices punish wishful thinking.
My operating advice: compare only true substitutes before publishing. Same street or immediate area, similar useful square metres, comparable lift situation, similar renovation level, similar floor. If you cannot find three clean comparables, reduce your valuation certainty. Admitted uncertainty beats dressing up a portal average as a sale promise.
Neighbourhoods with catalysts, not promises
Sant Andreu, Sant Martí, and La Marina del Prat Vermell have something more useful than an “emerging area” label: identifiable catalysts. Sant Andreu benefits from connectivity and a consolidated residential base; Sant Martí keeps the 22@ pull; La Marina combines planning, public housing, and new residential fabric. The municipal piece from Meet Barcelona on La Marina del Prat Vermell documents 424 protected homes in Sector 6, while BBVA Research frames limited supply as one of the main pressure points.
Stay cold here. A catalyst does not guarantee automatic appreciation. It helps only if it arrives, improves daily life, and has not already been fully priced into the purchase. The Idealista Barcelona series helps spot when asking prices have already run; Registradores property statistics help check whether those increases are closing or merely being advertised.
According to Félix Lores, principal economist for Spain and Portugal at BBVA Research, housing demand remains supported by employment, lower rates, and migration, while limited supply keeps pressure on prices into 2026. That is not a licence to buy anything. In Barcelona, it means waiting for a broad discount can be expensive when the specific asset is well chosen.
How to read the map without overpaying
Price maps are compasses, not valuations. To ground them, I combine asking-price sources such as Idealista Sarrià-Sant Gervasi with closing references such as Registradores, then move down to the building. The real discounts appear there: orientation, floor, lift, communal areas, pending works, energy rating, and noise.
- Compare only substitutable homes by micro-location, size, floor, and condition
- Separate asking price from closing price before negotiating
- Check IBI, community fees, pending works, and energy certificate before modelling cost
- Verify whether the neighbourhood has a real catalyst or just a sales narrative
- Set your maximum price before the second visit, not during negotiation
The temptation is to buy the district. The better decision is to buy a specific property. A renovated, bright flat in a mid-market district can beat a tired unit in a prime area. The opposite also happens: an excellent Eixample building can protect capital better than an apparent bargain with community problems in a cheaper area. Read Idealista Nou Barris beside the BBVA Research outlook and the pattern is clear: low price is not the same as low risk.
My view for 2026 and 2027
I do not see enough evidence for a broad Barcelona correction. Limited supply, internal demand, and external demand still weigh more than the desire to buy cheaply. BBVA Research points to sustained demand conditions, and Registradores showed that 2025 closed with relevant average-price growth.
My central scenario is a more uneven city by district. Prime areas should remain liquid, but with less forgiveness for a poor purchase. Entry districts should stay tense if buyers priced out of the Eixample keep searching for alternatives. Areas with public works or urban transformation, such as La Marina documented by Meet Barcelona, require patience and strict entry-price discipline.
If you are selling, do not publish with only a district average. If you are buying, do not fall for a low €/m² without checking the building, fixed costs, and liquidity. Open the Idealista Barcelona series, contrast it with Registradores, then inspect three real comparables. It is not glamorous work. It is what keeps you from overpaying by €30,000.
Sources
- Idealista price report, Barcelona city sale prices
- Idealista price report, Sarrià-Sant Gervasi
- Idealista price report, Nou Barris
- Estadísticas de propiedad
- El precio medio de la vivienda crece un 2,2% en el último trimestre del año y alcanza el 9,5% anual en 2025
- España Observatorio inmobiliario mayo 2025
- La Marina del Prat Vermell to add 424 new social housing units